- Published on, Time to read
- 🕒 1 min read
Breakpoint evaluation and logging in Rider

When it comes to debugging, there might be a case when the load of calls to the breakpoint is significant. Or, we want to log some data while debugging. In this case, it is useful to do not suspend the execution and evaluate the breakpoint condition and log the result (In JetBrains Rider).
That kind of trick is helpful in scenarios where debugger stops multiple time and we have an interest on certain property values.
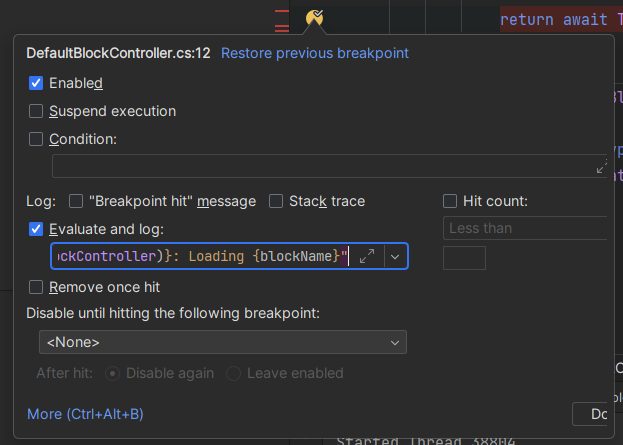
It can be achieved in Rider in a following way:
- Set a breakpoint.
- Click on More in the breakpoint window.
- Set "Evaluate and log" with the code you want to output.
- Optionally, you may suspend execution, so the breakpoint will not be stopped while debugging. In this case, breakpoint will appear as yellow.
- See the output in the Debug > Debug Output window.
See the screenshot below:
And the Debug Output for my case:
DefaultBlockController: Loading HeroBlock
DefaultBlockController: Loading ButtonBlock
DefaultBlockController: Loading TextBlock
DefaultBlockController: Loading HeroBlock
DefaultBlockController: Loading ButtonBlock
DefaultBlockController: Loading HeroBlock
DefaultBlockController: Loading ButtonBlock